Every quarter, companies announce share buybacks with the same press-release line: it “reflects our confidence in the business and our commitment to creating shareholder value.” Analysts raise their EPS estimates, and everyone moves on.
We’re not against buybacks. Returning cash that a business can’t invest at attractive returns on capital is exactly what a disciplined company should do. But the idea that a buyback creates value on its own doesn’t survive a simple example.
The setup
Take a company with the following starting point:
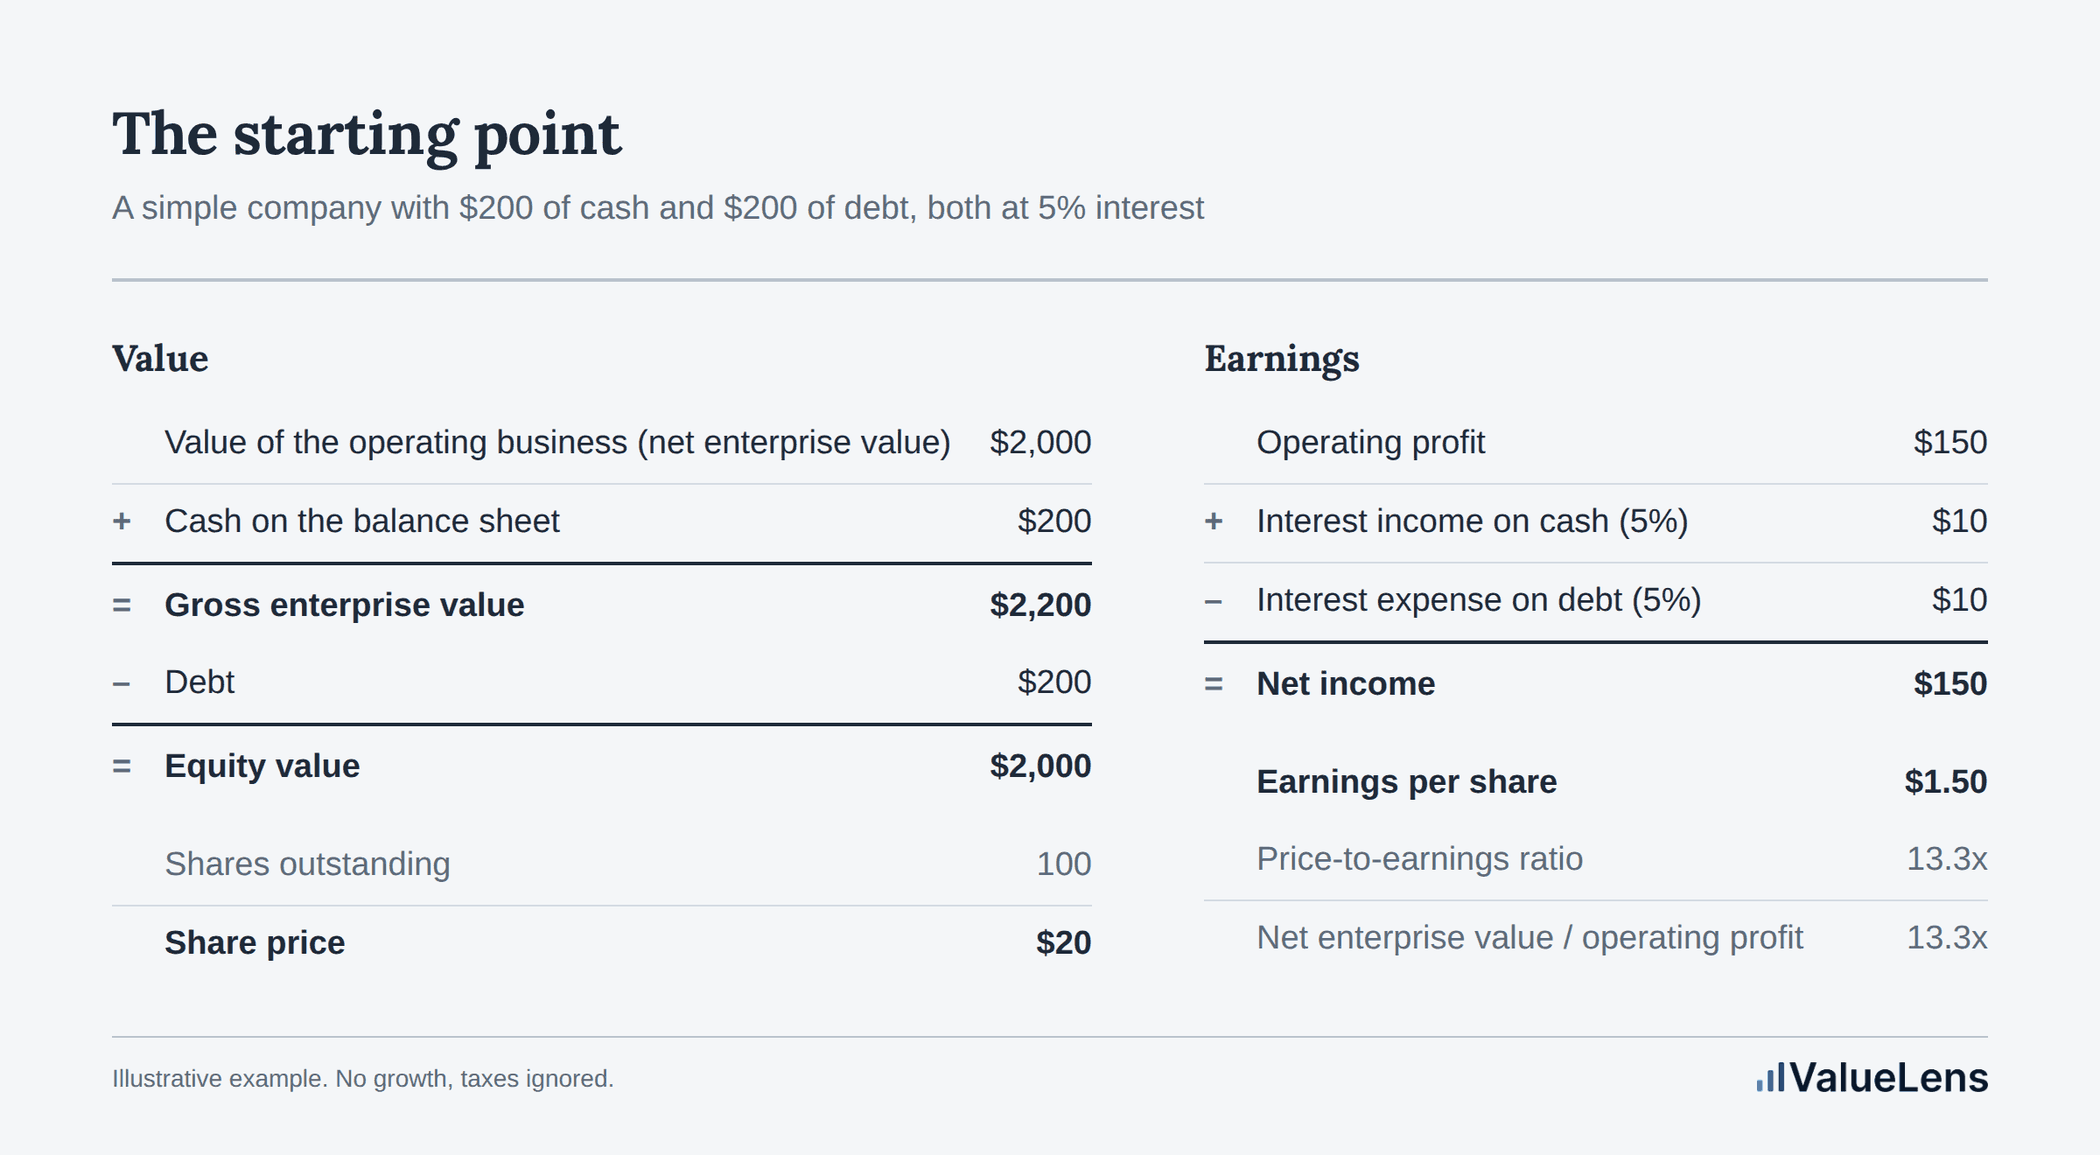
The cash and the debt both carry 5 percent interest, so they cancel out in the income statement. We assume the business doesn’t grow, ignore taxes, and use a 7.5 percent cost of capital, which is what values $150 of operating profit at $2,000, or 13.3 times. The question is what management should do with the $200.
Four options for the $200
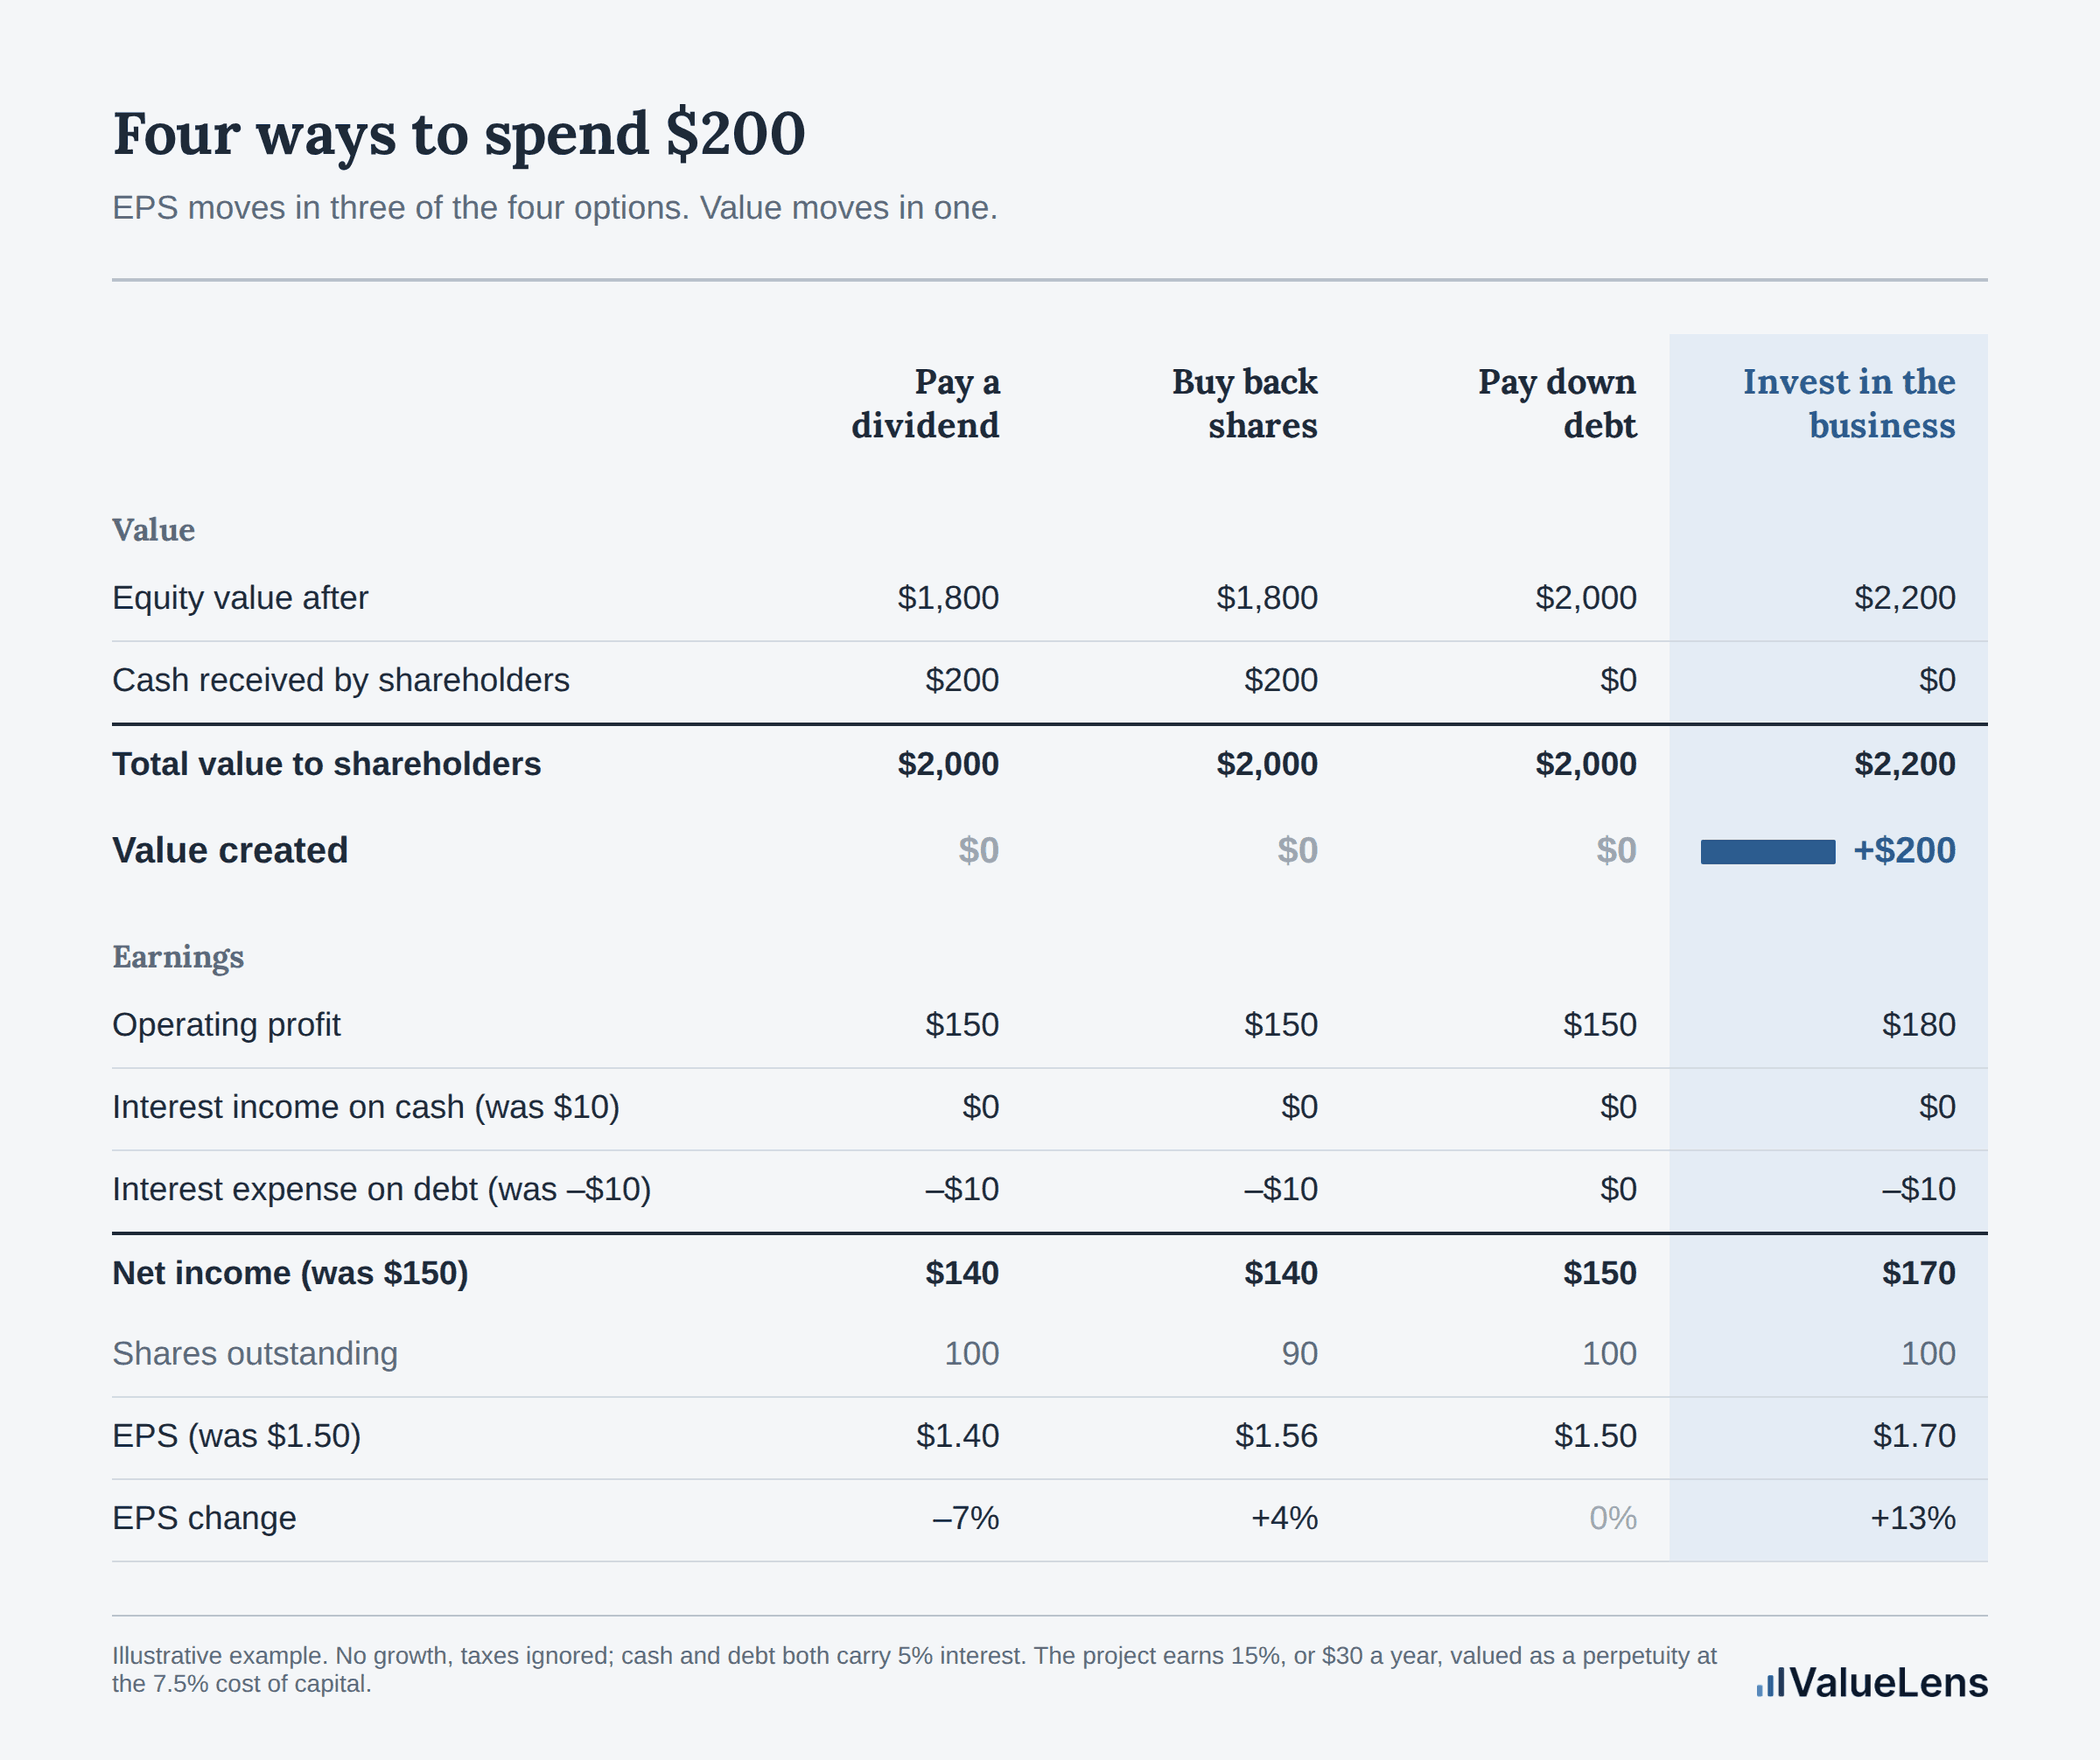
Pay a dividend. Shareholders receive $200 in cash ($2 per share). The equity is now worth $1,800: the $2,000 it started at, minus the $200 that left. Total value to shareholders: $1,800 of equity plus $200 of cash in hand, or $2,000. Exactly what they started with. EPS falls 7 percent, to $1.40, because the interest income on the cash is gone.
Buy back shares. The company buys 10 shares at $20. The equity is again worth $1,800, now split across 90 shares, so still $20 each. The sellers hold $200 in cash. Total value to shareholders: $1,800 of equity plus $200 of cash, or $2,000. Economically this is the dividend again, paid to some shareholders instead of all of them. But EPS rises 4 percent, to $1.56, because the same earnings are now spread over fewer shares.
Pay down debt. $200 of cash goes out and $200 of debt disappears. The equity is still worth $2,000: it lost $200 of cash and $200 of debt. Nothing is paid out to shareholders. Total value to shareholders: $2,000 of equity plus $0 of cash, or $2,000. EPS is unchanged at $1.50: the lost interest income and the saved interest expense cancel out.
Invest in the business. The $200 goes into a project earning 15 percent, or $30 a year of additional operating profit. Valued as a perpetuity at the company’s 7.5 percent cost of capital, the same rate that values the existing business, the project is worth $400. The equity is now worth $2,200: the $2,000 it started at, minus the $200 of cash that went in, plus the $400 project. Nothing is paid out. Total value to shareholders: $2,200 of equity plus $0 of cash, or $2,200. That is $200 more than they started with. EPS rises 13 percent, to $1.70.
What the table tells you
EPS moves in three of the four options. Value moves in only one, and it’s the one that has nothing to do with financial engineering. The value to shareholders after the dividend, the buyback, and the debt paydown is the same $2,000, rearranged.
The dividend and the buyback make this most obvious. They are worth exactly the same to shareholders, yet one cuts EPS by 7 percent and the other raises it by 4 percent. An 11-point swing in the metric most boards watch, and not a dollar of difference in value.
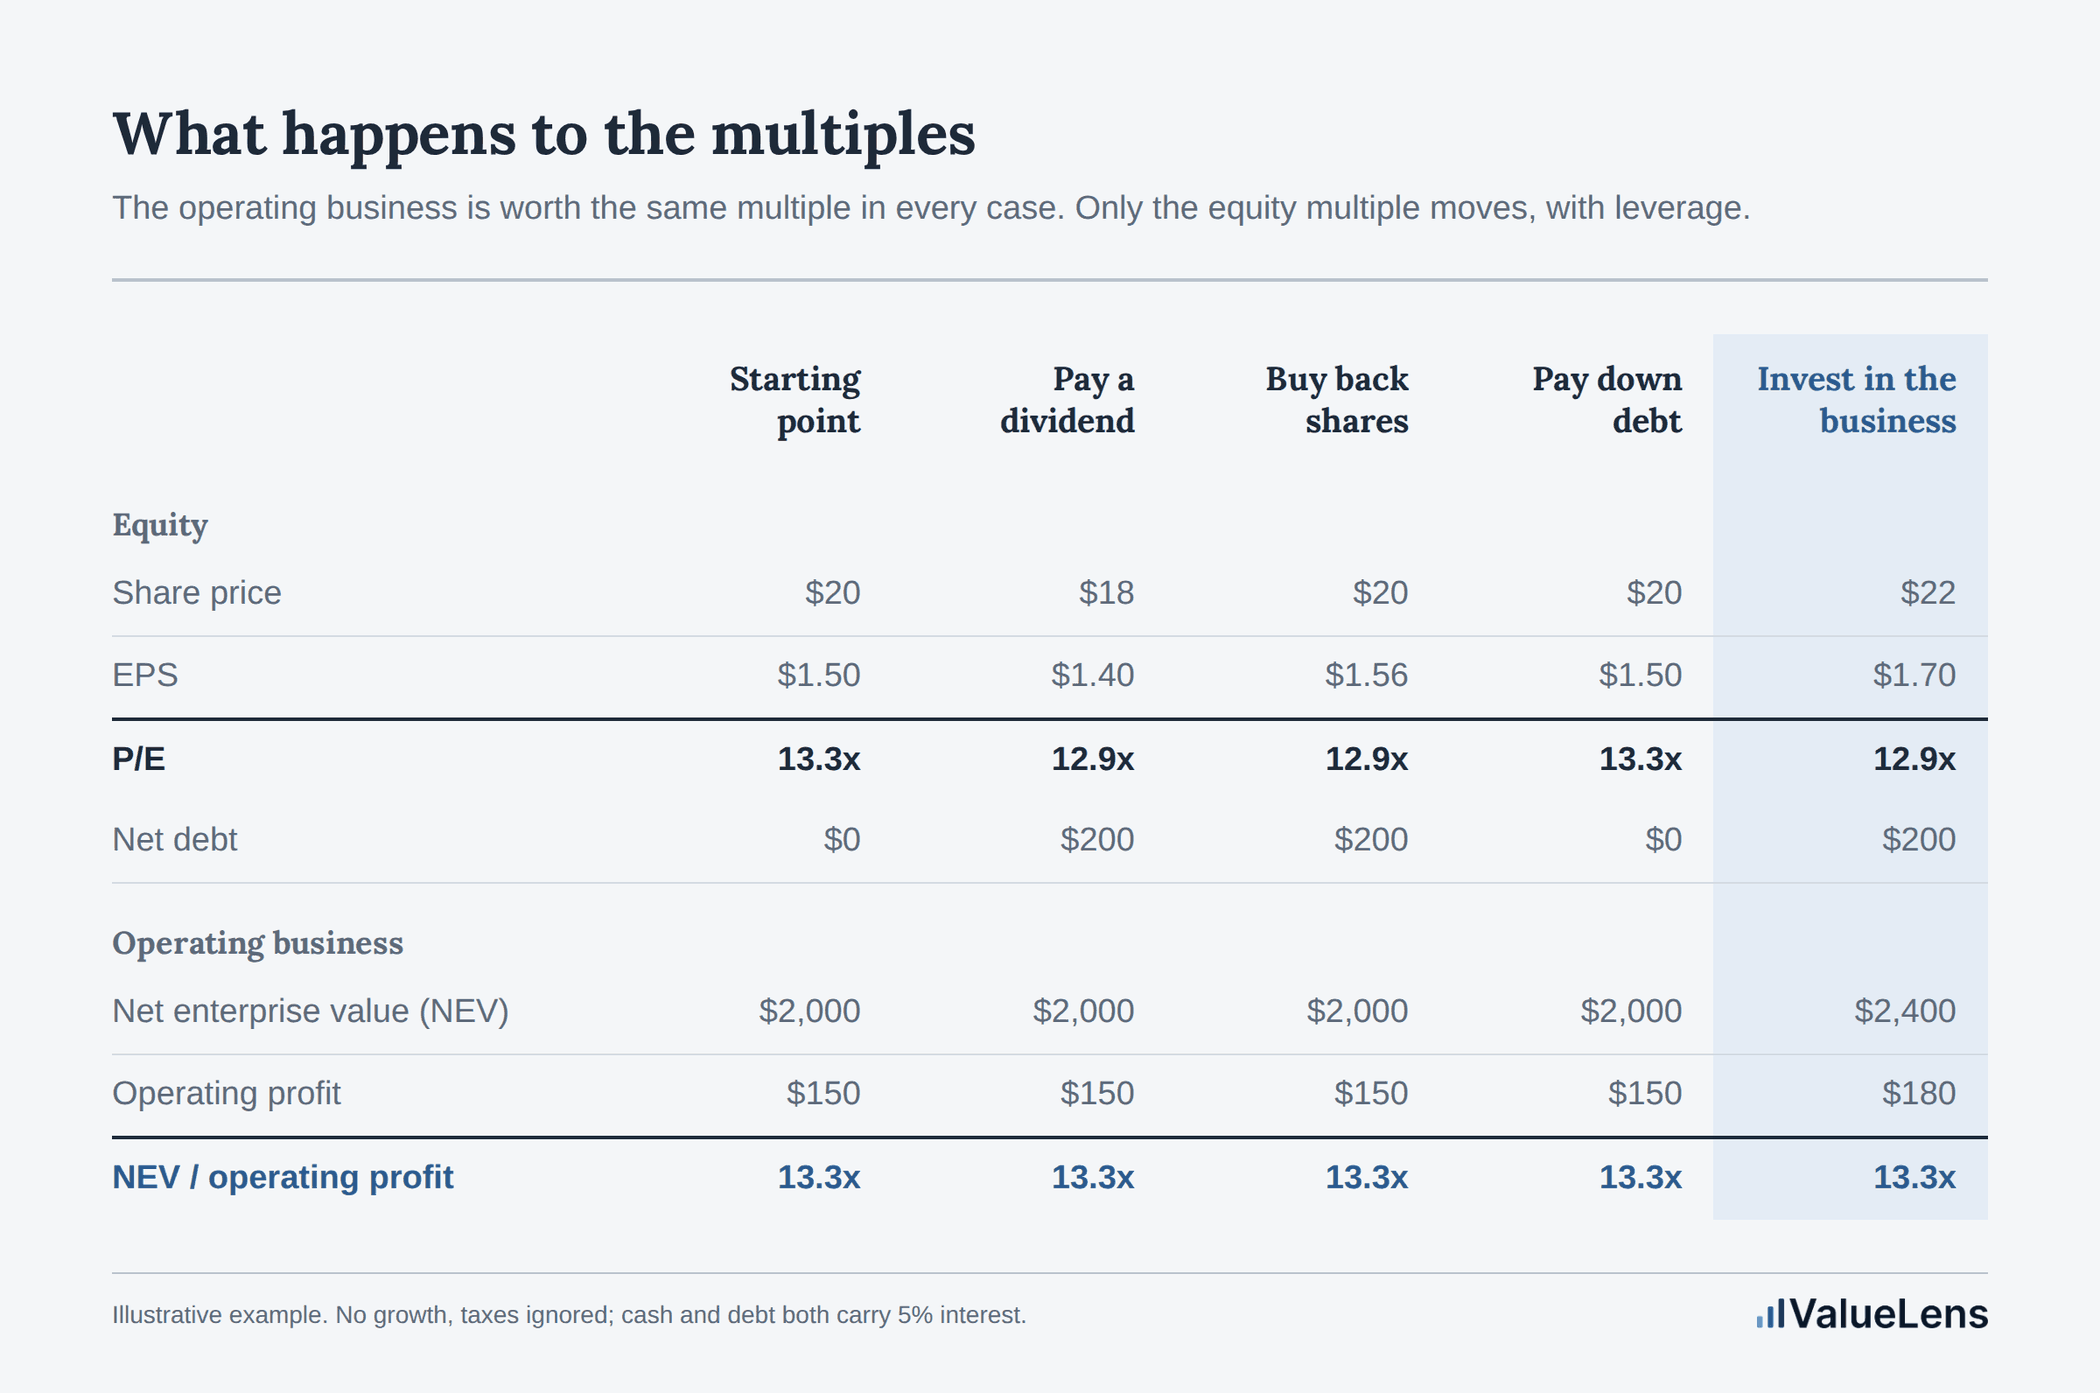
The multiples tell the same story from the other side. The operating business is worth 13.3 times its operating profit in every case. For the dividend, the buyback, and the debt paydown that is because nothing about the business changed: it is still worth $2,000 and still earns $150. For the investment it is because value and profit rose together: $400 of value on $30 of profit is the same 13.3 times. Value creation doesn’t show up as a higher multiple; it shows up as more profit at the same multiple. The project earns 15 percent on capital that costs 7.5 percent, which is why $200 of cash became $400 of value.
What does move is the P/E. It drops to 12.9 for the dividend, the buyback, and the investment, and holds at 13.3 for the debt paydown. That isn’t the market being stingy about buybacks. The three options that drop to 12.9 all leave the company with $200 of net debt, so each share is a claim on a more leveraged, riskier business. The debt paydown leaves no net debt, so the multiple holds. Higher or lower EPS, higher or lower P/E, same value.
Why the myth survives
If the arithmetic is this clear, why do so many boards believe buybacks create value? Partly because EPS is visible and value isn’t. And partly because the incentive is structural. A buyback lifts EPS immediately; a real investment often takes years to show up in earnings. Judged on next year’s EPS, the buyback wins almost every time. Judged on value, it never does on its own. Where executive pay is tied to EPS growth, that gap becomes a real problem for capital allocation.
The evidence matches the arithmetic. In 2016, McKinsey researchers found that without the contribution of growth and ROIC to TSR, there is no relationship between TSR and the intensity of a company’s share repurchases.1 A later update covering 1995 to 2021 reached the same conclusion: neither the payout size nor the mix automatically affects EBITA multiple or TSR for nonfinancial companies in the S&P 500.2
The one exception
There is one situation where a buyback moves value: when the shares trade below what the business is worth. Buying them then transfers value from the shareholders who sell to the ones who stay. That’s real, but it’s a transfer, not creation, and it depends on management being right that the stock is cheap. That is a much stronger claim than “we have excess cash.”
The academic studies that found positive returns after buyback announcements are often cited as proof that this works.3 Two things are worth knowing about that evidence. First, it has faded: later research found that the long-run abnormal returns following US repurchases disappeared for events after 2003, as more efficient pricing left less mispricing to exploit.4 Second, even where it held, it was largely a small-company effect. The original authors’ own follow-up found the abnormal returns concentrated in small, beaten-up value stocks, with a spread of more than 40 percentage points between the smallest and largest companies over four years, and attributed this to thin analyst coverage: in a company few people follow, executives can plausibly know more than the market.5 For a large, well-covered company, the exception all but disappears. And when shares are overpriced, the transfer runs the other way. The track record isn’t encouraging: most companies don’t time these purchases well anyway.6
The test
For any use of cash, ask the question the value-created row answers: did the pie get bigger? If not, returning the money may still be the right call. Just don’t call it value creation. A buyback is a way of handing shareholders their own money back, in a form that happens to flatter the earnings line.
At ValueLens, this is the question we bring to every capital-allocation decision: not whether a metric moved, but whether value did. The same logic applies to dividends, debt, acquisitions and reinvestment, and it is the logic the market applies whether or not the press release does.
If you would like to see how the market is reading your own capital allocation, get in touch.
Further reading
- Ezekoye, Koller & Mittal, “How share repurchases boost earnings without improving returns,” McKinsey, 2016 — mckinsey.com
- “Share repurchases still don’t prop up value,” McKinsey — mckinsey.com
- Ikenberry, Lakonishok & Vermaelen, “Market underreaction to open market share repurchases,” Journal of Financial Economics, 1995
- Fu & Huang, “The Persistence of Long-Run Abnormal Returns Following Stock Repurchases and Offerings,” Management Science, 2016
- Peyer & Vermaelen, “The Nature and Persistence of Buyback Anomalies,” Review of Financial Studies, 2009
- Jiang & Koller, “The savvy executive’s guide to buying back shares,” McKinsey, 2011 — mckinsey.com
Want to see how the market is reading your capital allocation?
Get in touch